CHAPTER – 05
SUPPLY – LAW OF SUPPLY AND PRICE ELASTICITY OF
SUPPLY
Definition of
Supply
ü Supply of a commodity refers to the quantity of a
commodity which producers or sellers are willing to produce and offer for sale
at a particular price during a particular period of time.
TYPES
OF SUPPLY
1.
Individual Supply
It refers to a quantity of a commodity which a single
producer is willing to produce and offer for sale at a particular price during
a particular period of time.
2.
Market Supply / Industry’s Supply
It refers to a quantity of a commodity which all the
producers are willing to produce and offer for sale at a particular price
during a particular period of time.
DIFFERENCES
BETWEEN STOCK AND SUPPLY
|
Stock
|
Supply
|
|
ü
Stock is the
total amount of the commodity available with the producers.
ü
It is unsold
goods.
ü
It has no time
dimensions.
|
ü
Supply is the
amount that producers are willing to bring into the market.
ü
It is the part
of stock which is offer for sale.
ü
It has a time
dimensions.
|
FACTORS
AFFECTING SUPPLY (DETERMINANTS)
1.
Price of a Product / Commodity
There is a direct
relationship between the price of a commodity and its supply. If the price of a
product increases, then the supply of the product also increases and
vice-versa.
2.
Goals of the Producers / Firms
Generally, supply of a
commodity increases only at higher prices as it fulfills the objective of
profit maximization. However, some firms are willing to supply more to capture
extensive markets and to enhance their status and prestige, thereby fulfilling
the objective of sales maximization. Similarly, if the firms aim at minimizing
the risk, they will play safe, produce less and supply less.
3.
Input Prices / Factor Prices
The inputs such as raw
materials, labour, equipment, machines etc. are available in sufficient
quantity at lower price, and then there would be increase in production and
supply and vice- versa.
4.
Prices of Related Commodities
The prices of
substitutes and complementary goods also affect the supply of a product. For
example, if the price of beans increases, then the farmers would tend to grow
more beans than other vegetables. This would decrease the supply of other
vegetables in the market.
5.
Technology
A better and advanced
technology increases the production which results in the increase in the supply
of product. For example, the production of fertilizers and good quality seeds
increased the production of crops. This further increase the supply of food
grains in the market.
6.
Nature of the Commodity
The supply is more on
the goods produced by the competitive firms compared to the monopolized
industry.
7.
Government’s Policies
The different policies of the government like
taxation and subsidy policies have a greater impact on the supply of a product.
For example, increase in the taxes (excise duty, sales tax etc.) would decrease
the supply of a product and vice-versa.
8.
Expectations of Future Prices
In case producers
expect an increase in the price of a commodity in future, then they will supply
less today and if price is expected to fall in future, supply will naturally
increase in the present period.
9.
Natural Factors
The climate conditions directly affect the supply of
certain products. For example, the supply of agricultural products increases
when monsoon comes on time. However, the supply of these products decreases at
the time of drought, flood, etc.
10.
Agreement Among Producers
Sometimes producers may
form a group and make some agreement to restrict the supply of a commodity to
earn large profits. They will create artificial scarcity of the commodities, as
a result supply decrease.
11.
Availability of Transport and Communication Facilities
A better transport and communication facilities will
expand the size of the market. This will motivate the producers to produce and
supply more.
SUPPLY FUNCTION
It states the relationship between
the quantity supplied of a commodity and its determinants.
Thus:
|
Sn
= f (Pn, P1….
Pn-1, Gf , Fi…Fm, T, E, Gt,
N, Mt…)
|
Where;
ü Sn – Quantity supplied of a commodity
‘n’.
ü f – Functional relation between supply and its
determinants.
ü Pn – Price of commodity ‘n’.
ü P1…. Pn-1 – Prices of all
other commodities.
ü Gf
– Goal of the firm.
ü Fi…Fm – Prices of different
factors of production.
ü T – Technique of production.
ü E – Expectation of future prices.
ü Gt –
Taxation policy of the Government.
ü N – Natural factors.
ü Mt
– Means of transportation.
LAW
OF SUPPLY
The law of supply states that, other
things remaining same, the quantity supplied increase with the increase in
price and decrease with the decrease in price.
Assumptions
of the Law
1.
There should be
no change in the prices of related goods.
2.
No change in the
taxation policy.
3.
The cost of
production should remain unchanged.
4.
No change in the
state of technology.
5.
The input prices
should not change.
ü The Law of Supply can be illustrated with the help
of Supply Schedule and Supply Curve.
SUPPLY
SCHEDULE
ü It is a table showing various quantity of a
commodity which producers / sellers are willing to produce and sell at
different prices during a given period of time OR it is the tabular
presentation of law of supply. It is of TWO
types:
1.
Individual
Supply Schedule
2.
Market Supply
Schedule
Individual
Supply Schedule
ü It is a table showing various quantity of a
commodity that an individual producer is willing to produce and sell at
different prices during a given period of time.
Individual Supply Schedule for Potatoes
|
Price
of Potatoes (Nu. Per kg)
|
Quantity
Supplied (kg per Month)
|
|
Nu. 60
Nu. 50
Nu. 40
Nu. 30
Nu. 20
|
50
40
30
20
10
|
Market
Supply Schedule
ü It is a table showing various quantity of a
commodity that all the producers / firm are willing to produce and sell at
different prices during a given period of time.
Market Supply Schedule for Potatoes
|
Price
(Nu.
Per kg)
|
Quantity
Supplied by Firm A
(kg
per Month)
|
Quantity
Supplied by Firm B
(kg
per Month)
|
Market
Supply
(A+B)
(kg
per Month)
|
|
20
30
40
50
60
|
10
20
30
40
50
|
5
10
15
20
25
|
15
30
45
60
75
|
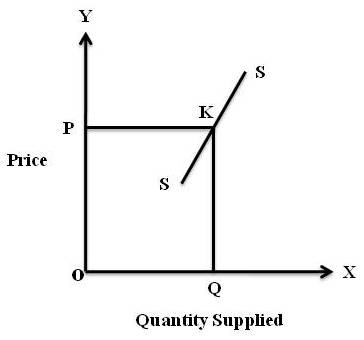
SUPPLY
CURVE
ü It is a curve showing various quantity of a
commodity which producers / sellers are willing to produce and sell at
different prices during a given period of time OR it is the diagrammatic
presentation of the law of supply. It is of TWO types:
1.
Individual
Supply Curve
2.
Market Supply Curve
Individual
Supply Curve
ü It is a curve showing various quantity of a
commodity that an individual producer is willing to produce and sell at
different prices during a given period of time OR it is the graphic
presentation of individual supply schedule.
Market
Supply Curve
ü It is a curve showing various quantity of a
commodity that all the producers are willing to produce and sell at different
prices during a given period of time OR it is the graphic presentation of
market supply schedule.